Adjust colors in the isoabsorbance plot
Data Analysis allows you to adjust the color map and the resolution of the isoabsorbance plot.
To change the values, select the required setting in the toolbar of the Isoabsorbance plot window:
Color map
-
Resolution
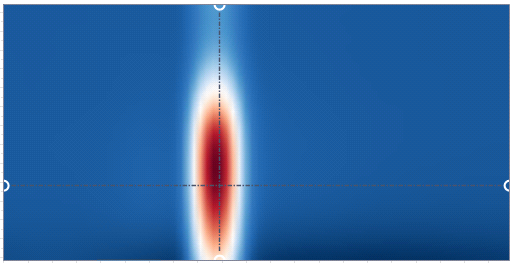
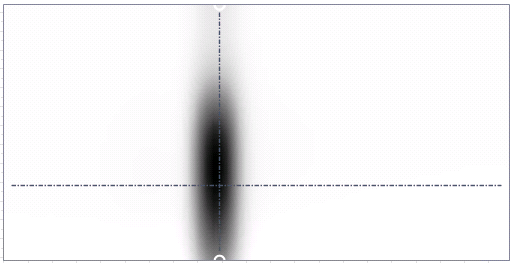
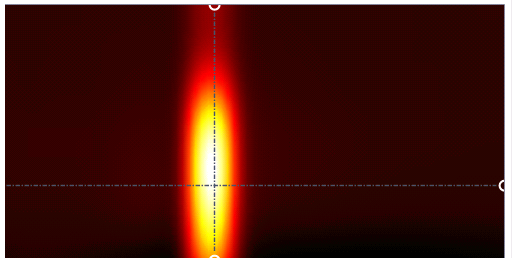
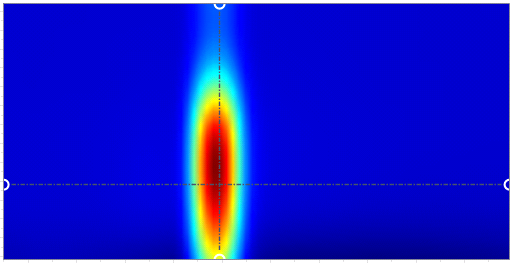
Color map
Blue to red |
|
Gray scale |
|
Hot |
|
Hue |
|
Jet |
|
Reverse blackbody |
|
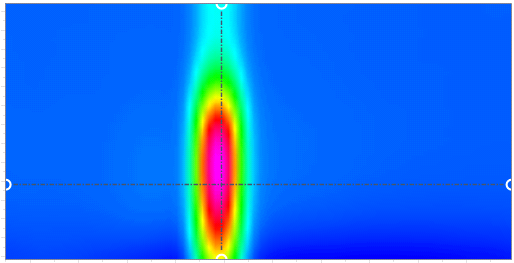
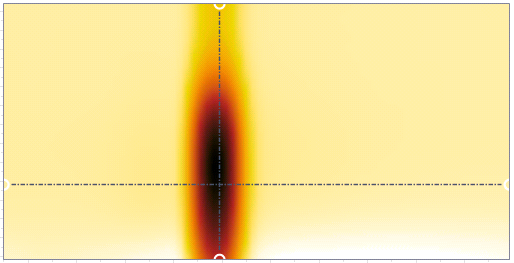
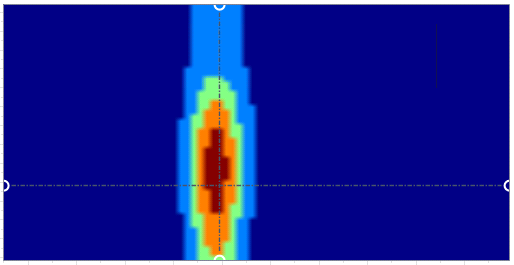
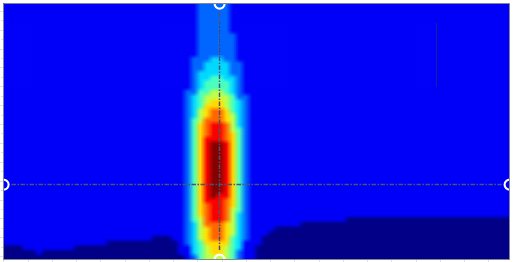
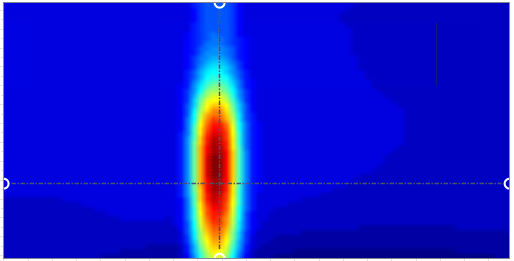
Resolution
Adjust the number of colors used to display the graph. See the following examples:
5 |
|
10 |
|
35 |
|