Isoabsorbance plot
What do you want to do?
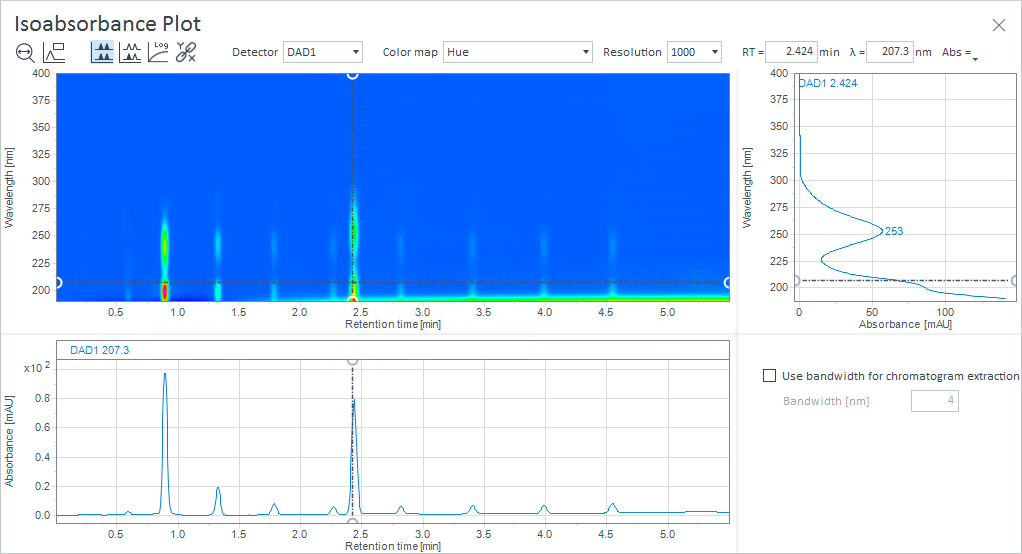
The Isoabsorbance plot window
The isoabsorbance plot gives an overview of retention times and UV spectra for injections with 3D UV signals. If different isoabsorbance plots are provided, you can select the detector in the toolbar of the isoabsorbance plot.
The x-axis shows the retention time
If a signal uses a delay (see Align chromatograms from multiple detectors), the updated retention time is shown.
The y-axis shows the wavelength
The color reflects the response, that is, the UV absorbance.
Note that blank subtraction is not taken into account.
At the bottom of the isoabsorbance plot, the extracted chromatogram is shown for a specific wavelength.
To the right of the isoabsorbance plot , the spectrum is shown for a specific retention time. The wavelengths of peak apexes (λmax) are annotated.
Drag the dashed lines to view the corresponding chromatograms and UV spectra. All graphs are synchronized.
Subpages
- Find the best retention time and wavelength
- Adjust colors in the isoabsorbance plot
- Zoom and scale the isoabsorbance plot
- Use a different bandwidth
- Change window proportions
- Pin and compare different graphs from the isoabsorbance plot
- Save extraction parameters to the processing method
- Export isoabsorbance plot, chromatogram, or spectrum
base-id: 11013407755
id: 9007210268148747