Find the best retention time and wavelength
Drag the lines
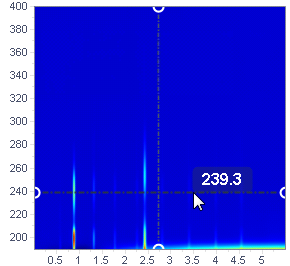
To compare chromatograms and spectra at different retention times and wavelengths, drag the dashed lines.
All graphs are synchronized. While moving, the corresponding retention time or wavelength is shown.
Enter values
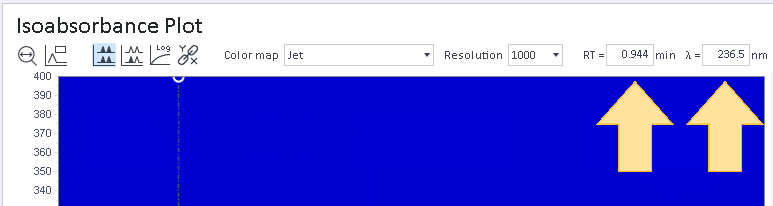
To see the chromatogram for a specific wavelength, enter the wavelength ito the field in the toolbar.
To see the spectrum at a specific retention time, enter the retention time.
Press Enter to confirm.
base-id: 11016379019
id: 9007210271120011