Graphically extract an EIC from an MS spectrum
Privileges
|
Prerequisites
|
-
In the MS Spectrum window, select
 Activate/Deactivate EIC
Extraction.
Activate/Deactivate EIC
Extraction.In the graph, a line appears to select the m/z value or range.
The icon
 indicates that graphical EIC extraction is
activated.
indicates that graphical EIC extraction is
activated. -
To extract an EIC for a single m/z value, simply click the required value.
Depending on the settings in the MS Spectrum Properties dialog, you may need to click
 to confirm.
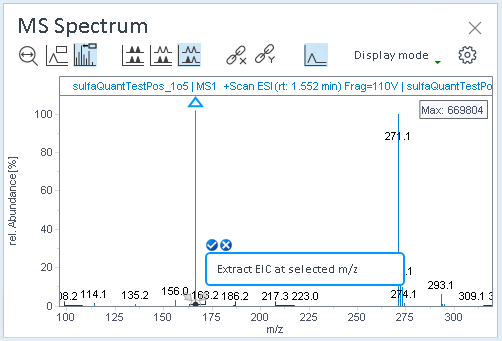
-
To extract an EIC for the largest mass ion in a specific m/z range, click and drag the cursor over the required range.
When asked for confirmation, select At maxima in range, and click
to confirm.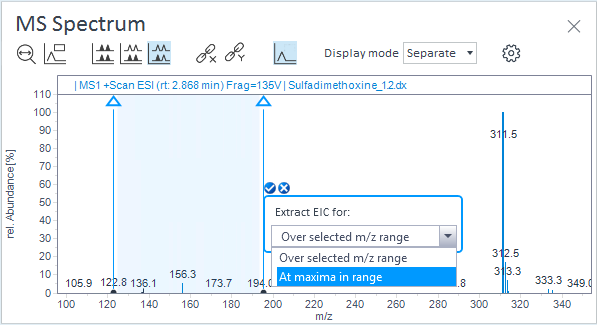
-
To extract an EIC over a range of m/z values, click and drag the cursor over the required range.
When asked for confirmation, select Over selected m/z range, and click
to confirm.
The corresponding chromatogram is extracted and added to the list of Extracted Chromatograms in the injection tree.
base-id: 11017251467
id: 9007210271992459