Extracted Ion Chromatogram (EIC) and Selected Ion Monitoring (SIM)
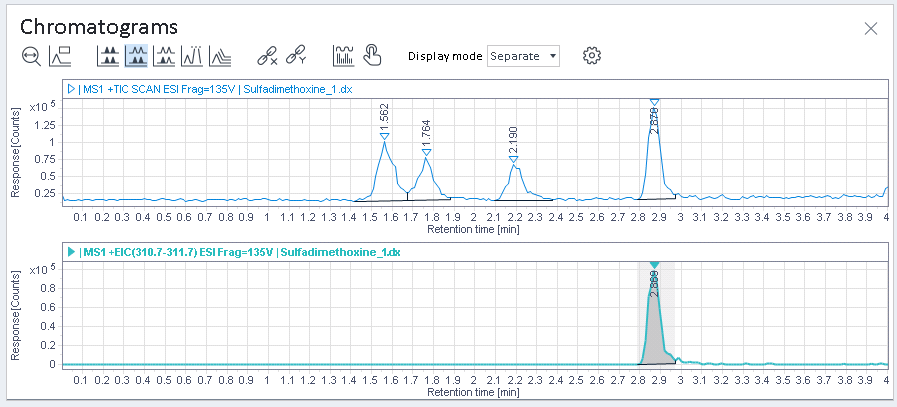
Extracted Ion Chromatograms (EIC) show the response of a specific m/z value or range extracted from the TIC SCAN signal over a defined time range. For example, the following figure shows the TIC SCAN and an EIC that has been extracted for m/z 311.
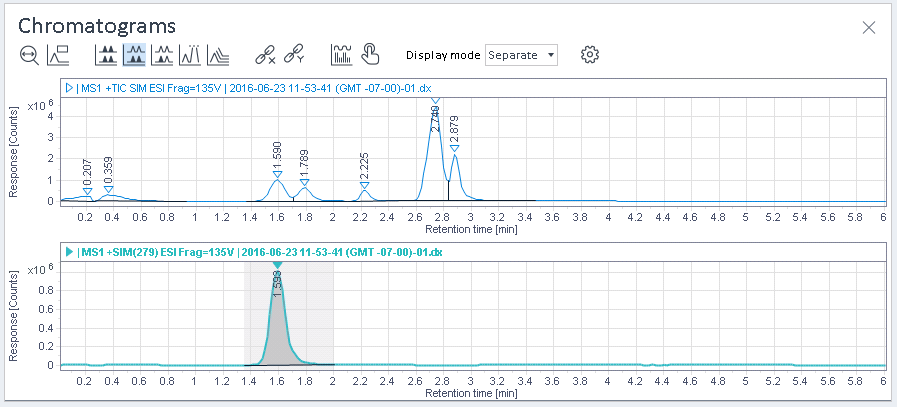
Selected Ion Monitoring (SIM) signals show the response of a specific ion that has been configured in the acquisition method. All SIM signals are summed up to the TIC SIM signal. For data acquired with OpenLab CDS, the TIC SIM signal is available in a SIM result set. You can separately display all single ion chromatograms (SIMs) that make up the TIC SIM signal. The following figure shows a TIC SIM, and a specific SIM signal.
Subpages
base-id: 11014285067
id: 18014409523767051