Data Processing View: Injection Tree
What do you want to do?
Injection Tree
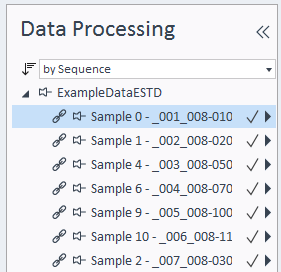
The injection tree displays your injections in a hierarchical tree. The tree shows the sequence names, sample names and data file names of the loaded injections. For each injection you can expand the available signals.
The tree is grouped by sequence or sample, where the grouping nodes are alphabetically sorted by name. The injections in each node are sorted by sample order number, injection order number, and acquisition date/time. With the drop-down list at the top of the injection tree, you can select a different sort order.
The following symbols may be shown for an injection:
| All injections with this symbol are linked to the same processing method. |
| Expand to show available signals |
| Injections marked with a plus sign are selected for creating a new result set. |
| Injections with a horizontal white pin are unpinned. |
| Injections with a vertical black pin are pinned. |
| The data file has successfully been reprocessed. |
| Results and parameters (method or injection list) are inconsistent and need to be reprocessed. |
* | Manual integration has been added to the data. |
| The result set is locked. |
| The injection or result set is signed. |
| The data file is read-only. It may have been archived "in place" in Content Management. |
| The data file could not be reprocessed. There is no processing method linked to the data file. |
| Warnings occurred during reprocessing. |
| Reprocessing has been stopped, or an error occurred. |


Signals in injection details
Each injection may include multiple signals. Click  next to an injection to expand the signals.
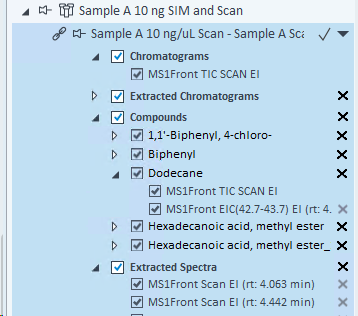
Signals are grouped by the following categories:
Chromatograms
All chromatograms of the injection
Extracted Chromatograms
All extracted chromatograms, if available.
Note that chromatograms extracted around a compound’s retention time appear under Compounds for that compound.
Compounds
After processing the injection: All compounds defined in the linked processing method. For each compound, all signals are listed that allow identifying the compound. In Mass Spectrometry, this includes any available MS base peak EIC and any qualifier signals for a compound.
Extracted spectra
All extracted spectra, if available
Signal selector
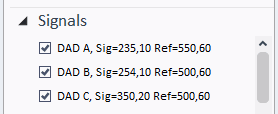
The Signal Selection area (also referred to as Signal Selector ) shows all signals of all injections in the injection tree. The signals are alphabetically ordered by detector. If you change the signal selection, the content of the different windows is automatically updated.
If blank subtraction or smoothing have been applied to a signal, the signal name starts with an asterisk (*) and ends with [b] or [s] respectively.
Instrument Traces
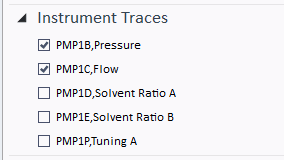
The Instrument Traces area lists all instrument traces such as pressure, solvent ratio, or temperature, that have been recorded during data acquisition. The list contains all available traces for all currently loaded injections.
The selected instrument traces are shown in the Chromatograms window and are handled the same way as signals. If you want to show the instrument traces in an overlaid graph, use the Relative full scale scaling option to make sure all information is shown.
Method selector
The Methods area (also referred to as Method Selector) lists all methods associated with the loaded data. The methods are arranged in alphabetical order. When you select an injection with a linked method, the method is automatically selected in the method selector.
The following symbols may be shown for a method:
| The method is linked to the data files that are shown with the same symbol. |
| The method has been updated. The changes are not saved yet. The change can be caused by: changes to the method parameters additional entries to the method audit trail caused by an audit trail review or injection linking automatic updates during reprocessing, such as calibration calculations or retention time updates |
| The method is read-only (for example, due to archiving in Content Management). |
| The method is a result set method, that is, it is located in a result set directory. |
* | An asterisk is prepended if a result set method has been changed interactively after linking. |
| License missing. The license shown in the tool tip is required to link or modify this method. |


For more information about method versioning, see Versioning.
base-id: 11012264971
id: 18014409521746955