Calibration curves for a single compound
To show the calibration curves for single compound, you have the following options:
Add the Calibration Curves Overlaid snippet and filter the calibration curve item for the required compound (for example, Compound_Name="TRAMADOL"). Only one calibration curve will be shown in the report.
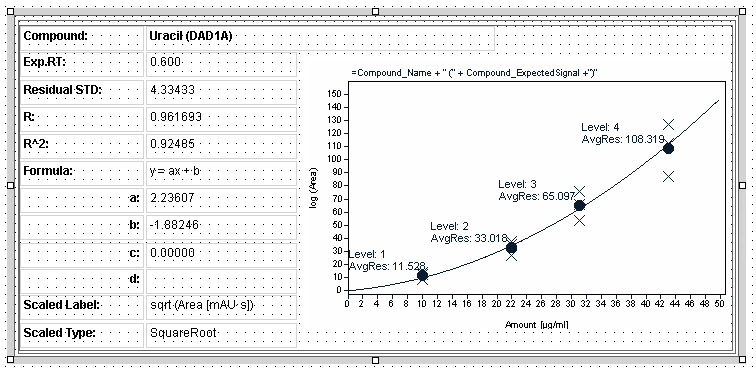
Add the Calib Curve Plot by Compound snippet. A composite group will be shown that is repeated on the compound name. The composite group also contains some more information on the calibration curve, such as the formula or the correlation coefficient.
|
If a ChemStation data file was processed with a non-matching calibration table, the report shows an empty calibration curve, and no peaks are identified. This happens if the calibration table has been set up for one signal, but data have been recorded for a different signal. Ensure that the signal description in the calibration table exactly matches the DAD signal set up in the used method (for example, DAD1A 254,4 Ref 360,600). |