Series Group
You can place several series of data in the same chart. For example, you may want to create a chart that shows the stability of retention times over a set of injections. If there are several compounds, you can show a separate line for each compound. In this case, create a category group based on the injection ID, and a series group which is grouped by the compound name. The result may resemble the following line chart.
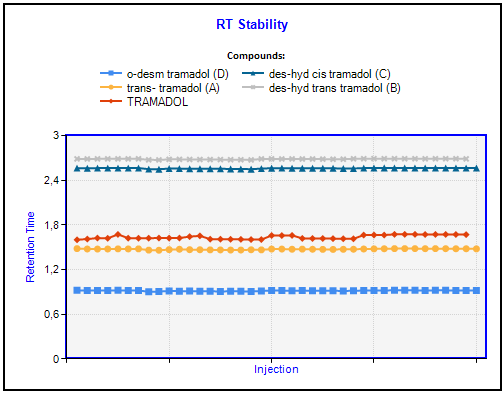
Y-value: = Peak_RetentionTime
Format code for y-axis label: F1
Category group expression: = Injection_ID
Category sorted by: = Injection_AcquiredDate
Series group expression: = Compound_Name
base-id: 11031292683
id: 11031292683