Spectra
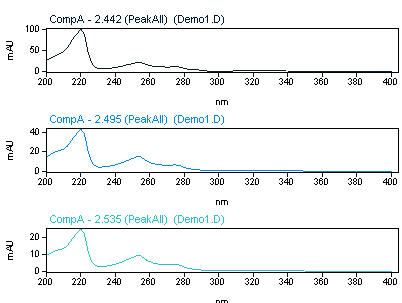
With spectra report items, you can place the visual output of an optical 3D detector (for example, a diode array detector) or of an MS detector on your report template. The spectra shown in the graph correspond to your selection of the positions in each peak.
With UV data, you can extract spectra at different peak positions (start, apex, or end of a peak). With MS data, always apex spectra will be shown. You can filter the data shown in a spectrum using the filter list.
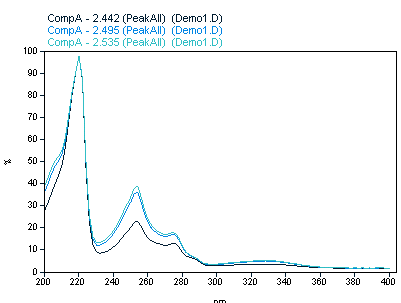
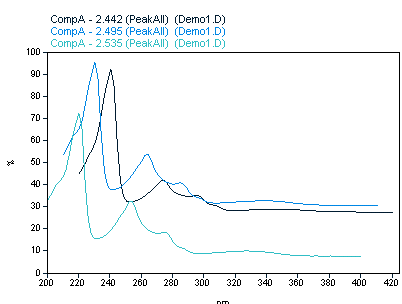
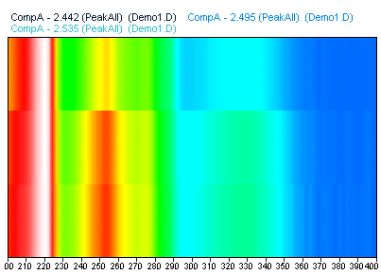
Depending on the configuration of the report item, multiple spectra may be shown in separate graphs, overlaid graphs, stacked graphs, or as Iso plots. If there are spectra for different compounds, you can group the spectra by compound name.
Subpages
base-id: 11031122699
id: 9007210285863691