Table groups
With table groups, you can structure the detail rows of a table. You can define specific header rows, and show footer rows with summary information specifically for that group.
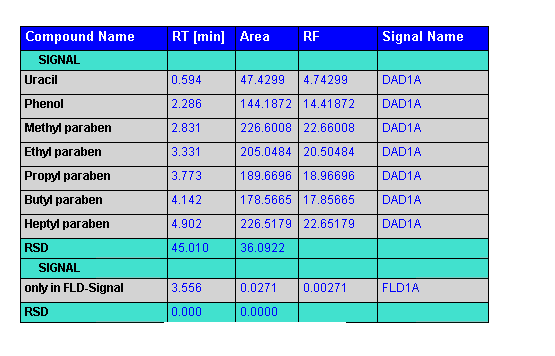
For example, if you used two detector wavelengths for signal detection, you get two signals for each detected compound. In this case, you can create a table group for the detector wavelengths in order to show all signals of one wavelength under each other, with a group header above and a summarizing footer below the details rows.
Usage of table groups is limited to max. three groups. The order of grouping is defined by the position of the group in the list.
Two groups will be shown with header/footer lines in the report template, the third group will only be used to organize the detail rows in the table.
Preparation for using table groups
Using table groups can make the table quite complex, especially if there is more than one group. It is important that you plan the table groups in advance and know exactly how the groups will structure your data. Otherwise, you might get unexpected results and will not know which properties of which group must be changed to correct the table.
Use the following guidelines before creating table groups:
What is the top-level element in your report template? Use this element for the Repeat Table On setting.
Which field should be used to group the detail data? Which (static) sub headline should be used for the groups? Use this information for the Group On setting in the table group.
Which fields should be used to sort the detail data inside each group? Use this information in the properties of the table itself. The table sorting will overrule the table group sorting.
Which footers do you need needed for each table group? The use of headers or footers is optional. It may be useful to provide a summary of statistical information on a specific table group.
Subpages
See Also
base-id: 11030405515
id: 18014409539887499