Tables
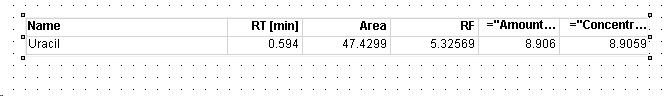
With tables, you can display results in a 2-dimensional format. Tables are used, for example, to summarize the results of samples/sequences. The amount of columns and the headlines are static, the number of rows corresponds to the number of records in the dataset.
Basically, each table contains a specific dataset that is determined by the type of the base template. Thus, without any further configuration, the table would show one row for each record in the dataset, where the records are unsorted, ungrouped, and unfiltered. In order to organize and structure the data, you have the following options for configuring a table:
Each table contains a specific dataset. Without any further configuration, the table would show one row for each record in the dataset, where the records are unsorted, ungrouped, and unfiltered. In order to organize and structure the data, you have the following options for configuring a table:
Repeat Table On: Display the table several times, where each table only contains the data according to the value of specific key information. The particular values (for example, compound names) are used as table headers.
Grouping: The detail rows are arranged according to the distinct values of a given key information (for example, the distinct sample names).
Sorting: The detail rows are sorted according to a given key information.
Filtering: Exclude specific data from the table content.
Area Rejection: Exclude information on peaks that are too small.
Show Peak Types: Specify the type of peaks to be shown in a table (for example, Identified Peaks or Unknown Peaks).
The table report items available in the Report Items browser are all preconfigured in a specific way, so you can use them with only a few adjustments.
Subpages
See Also
base-id: 11030398219
id: 36028808049362187