Place multiple curves in a row
Calibration curves are shown one under each other by default. However, you can configure the report item so that multiple curves are shown side by side in the same row.
To place multiple curves in a row
-
Add a calibration curve report item to your template.
-
In Calibration Curve Properties, select the Multi Curves page.
-
Under Display format, select Separate.
Only separate graphs can be shown side by side in the same row.
-
In Calibration Curve Properties, select the Layout page.
-
In the # Graphics field, enter the number of curves to be shown in one row. For example, enter 4 to show four curves in one row.
-
Save your settings.
The given number of curves is now shown in the same row.
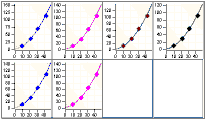
Figure: Four calibration curves in the same row
base-id: 11030897419
id: 11030897419