Contour Plot 2D
With the 2D-LC > Contour Plot 2D snippet, you add a contour plot to your report template. The contour plot is always shown by signal name.
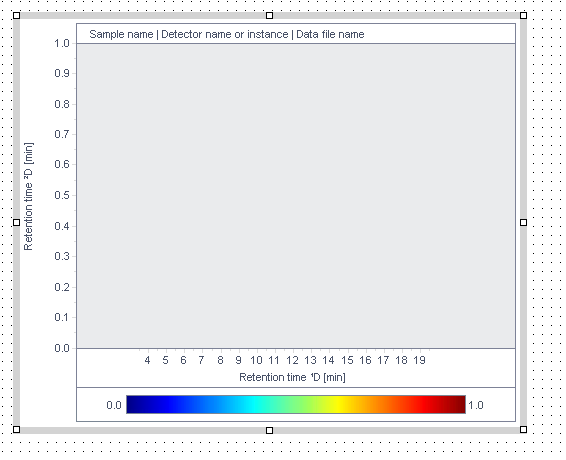
In the Report Editor window, a generic plot is shown.
Contour Plot 2D Properties
Compounds | |
|---|---|
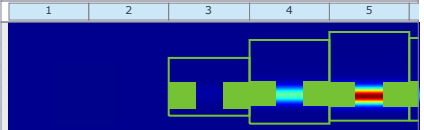
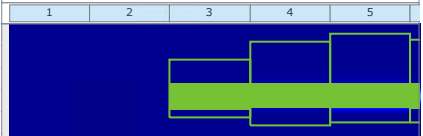
Show 2D peak regions | If selected, 2D peaks are shown outlined in the contour plot (see Add a 2D peak as a 2D compound to the processing method). |
Show compound labels | If selected, labels are shown for identified 2D peaks (see Show compound labels in the contour plot). |
Display | |
|---|---|
Enable interpolation | If selected, the contour plot is shown in interpolation mode (see Apply interpolation mode). |
Show cut annotations | If selected, the cut numbers are shown at the top of the contour plot.
|
Color map | Choose the color map as required. |
Color Map Scale | Choose if you want to apply the same color gradient to all signals (default), or if you want to calculate the color gradient per pane. |
UV Purity | |
|---|---|
Show UV purity results | If selected, the UV peak purity or impurity classifications are shown. As there no transparent coloring as in the Data Processing view (see Show UV Peak purity in the Contour Plot 2D), choose the appropriate option: Partial cut cover: displays the UV purity result on each left and right border, covering only two thirds of the cut.
Full cut cover: corresponds to what you see in the Data processing view without moving the mouse pointer over the peaks.
|
Scaling | |
|---|---|
Use ¹D custom scale | If selected, you can configure a specific ¹D retention time range. Provide the From and To values as required. The Contour Plot 2D report item makes sure that the cuts in a given ¹D retention time range are always fully plotted. If parts of a cut are outside the given range, the range will be expanded so that all cuts are included completely. If there are no cuts at all in a given ¹D retention time range the plot area will be empty. |
Use ²D custom scale | If selected, you can configure a specific ²D retention time range. Provide the From and To values as required. |
base-id: 10237652363
id: 10237652363