Show instrument traces of 2nd dimension
-
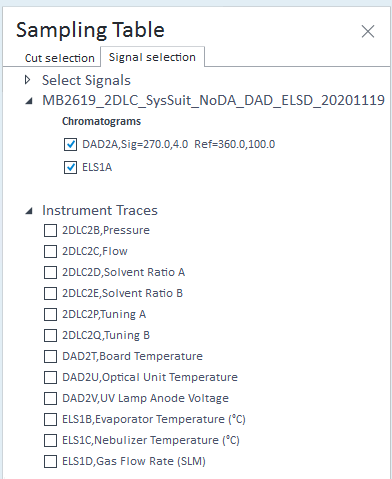
Open the Signal Selection tab of the Sampling Table window.
If your data contains instrument traces of the 2nd dimension, an Instrument Traces node is shown.
-
Expand the Instrument Traces node.
-
Select the instrument traces that you want to show.
The corresponding Instrument traces are shown in the Diagnostic Signals window.
Optional: To show the instrument traces in an overlaid graph, choose the Overlaid display mode, and select the Relative full scale option in the toolbar:

base-id: 10237097739
id: 10237097739