Sampling Table
What do you want to do?
Sampling Table - Cut selection tab
The Cut selection tab of the Sampling Table window shows details of the cuts in the 1st dimension, which were then further analyzed in the 2nd dimension. If the data contains multiple injections or series of consecutive cuts, the cuts are arranged by the respective names. A separate section Heart Cuts contains all cuts of a Multiple Heart Cutting injection.
To expand or collapse a section, click the  or
or  icons, or right-click a section and select Expand or Collapse from the context menu.
Each row in this table represents a cut. The following columns are available:
|
Cut # |
Number of the cut. |
|
Cut size [s] |
Time period for which the cut of the first dimension is loaded into the sample loop. |
|
¹D Cut start [min] |
Start time of the cut in the first dimension. |
|
²D Run start [min] |
Start time of the run in the second dimension. |
|
Deck |
The deck where the sample has been stored. |
|
Loop |
The loop where the sample has been stored. |
|
Trigger |
The mode in which the cut was performed. This can be a time-based or peak-based operation. |
|
Lost Reason |
The reason why a lost cut was lost. Lost cuts are listed with the lost reason, even if the column is not selected in the Column Chooser. |
|
Multi-inject |
If High-Resolution data is acquired in multi-inject mode: The cut number range of the sequently injected cuts. The cut number range is displayed, even if the column is not selected in the Column Chooser. |
Sampling Table - Signal selection tab
The Signal Selection tab of the Sampling Table displays all ²D detector signals available for an injection. If you selected several injections, cut series, or cuts, a tree structure allows you to select signals individually on each level.
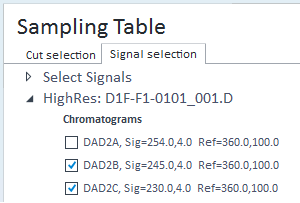
For more information, see Select signals from the 2nd dimension.
Subpages
base-id: 10237088139
id: 10237088139