Show peak regions
Show all peak regions permanently
In the Contour Plot 2D window, click
 Show 2D peak regions.
The regions that the software recognizes as one 2D peak are surrounded by a border.
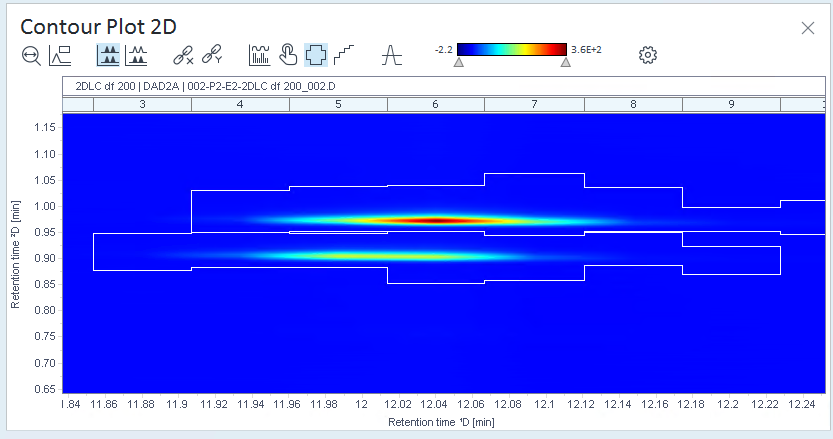
If the peak regions do not correspond to your compounds,optimize the integration parameters, optimize the method, or integrate manually.
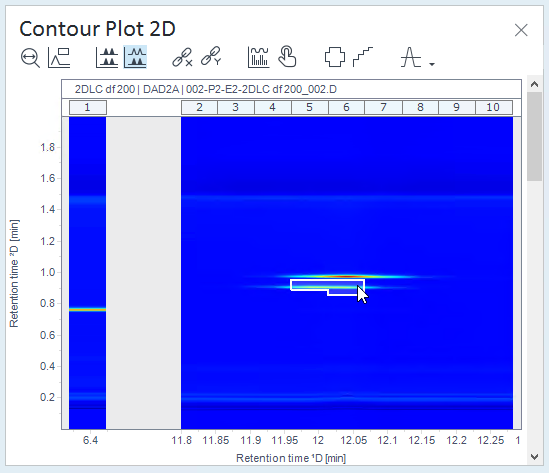
Show only the 2D peak at the current mouse position
-
In the Contour Plot 2D window, ensure that the
Show 2D
peak regions tool is not selected. -
Click the Properties icon
 in the toolbar.
 -
Select the Contour Plot 2D page.
-
Select the Show 2D peaks at mouse position check box.
-
Click OK.
Peak regions are highlighted when you move the mouse over a peak region.
Peak regions that you selected by clicking in one of the other windows remain highlighted as well.
참고
If you chose to show compound labels, they are permanently shown, independent of the mouse location.
base-id: 10237171595
id: 10237171595