Instruments
Displays all your instruments including information about their type, status, workload, etc. The layout depends on the window size on your device.
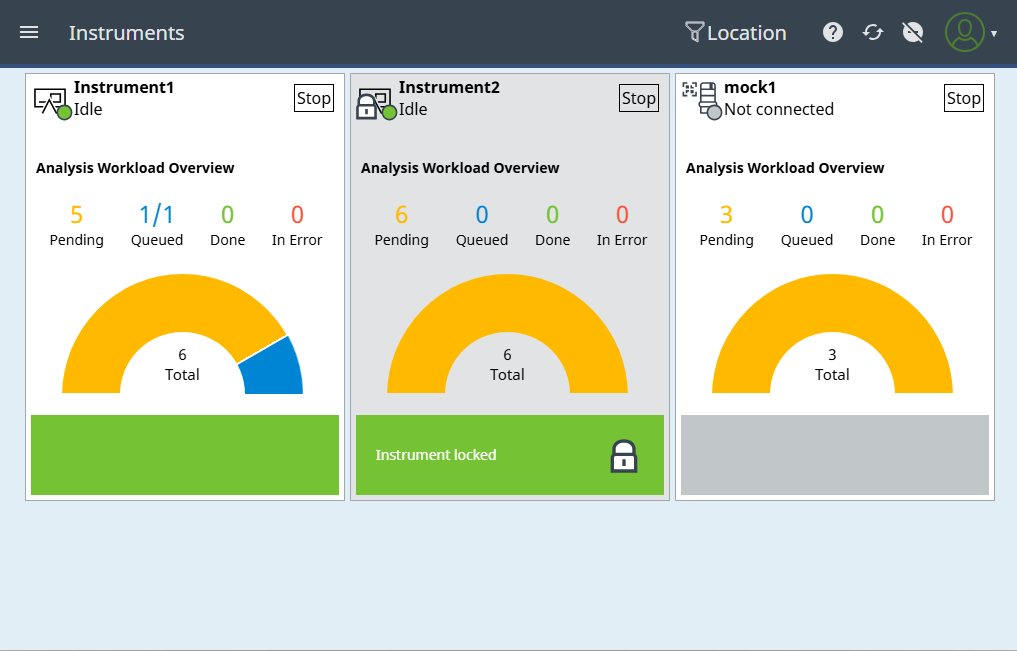
Instruments view on a desktop/tablet
In larger windows on a desktop or tablet, the Instruments view shows expanded instrument tiles for all instruments.
Instruments view on a smartphone
For devices with a width of less than 670 pixel, the instruments are listed in a collapsed view.
Click or tap to expand an instrument tile and see further details on the workload, current analyses and sequences, or instrument errors.
Instrument tile
The Workload status for Pending or Queued analyses shows both the number of your analyses and the total number of pending or queued analyses for the instrument.
The half-circle radar shown for each instrument summarizes information about the total number and the workload state of your analyses. This also includes analyses contained in sequences. For more information, see Analyses workload area.
The details area shows information on running analyses. It is empty for idle instruments. In case of an error, the area turns red and displays the instrument error message.
You can stop all active analyses in the queue of an instrument by clicking or tapping the  button. For more information, see Stop instrument.
Note that in the case of an instrument error, the error information is displayed in the details area.
If an instrument is locked, a  padlock is displayed next to the instrument status and the instrument tile is greyed out.
What do you want to do?
View my currently used instruments
Filter instruments by location
View the entire workload of an instrument
Subpages
base-id: 11194579979
id: 18014409704061963