Save extraction parameters to the processing method
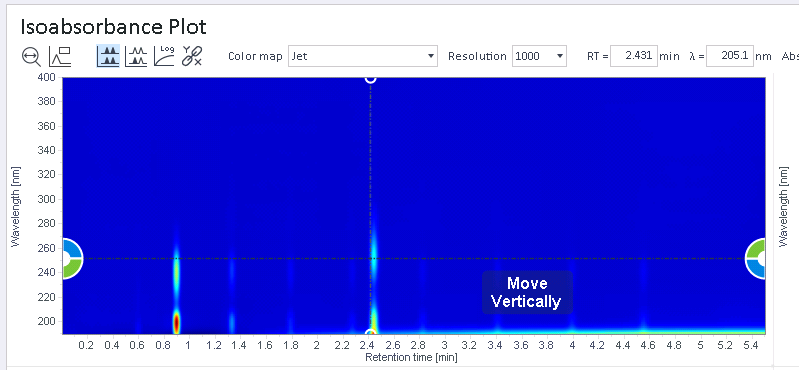
When checking the isoabsorbance plot, you may find a wavelength that is suitable to extract chromatograms in your analysis. Follow the procedure below to add the corresponding parameters to your processing method.
Preparations
|
-
Move the mouse over the horizontal line. You can use both the line in the isoabsorbance plot or the line in the spectrum.
A wheel is shown at both sides of the graph that offers different functions.

-
Click the blue segment of the wheel.
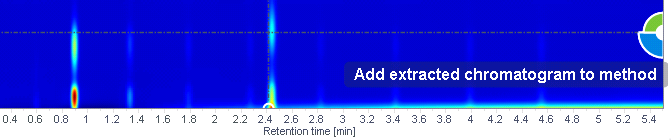
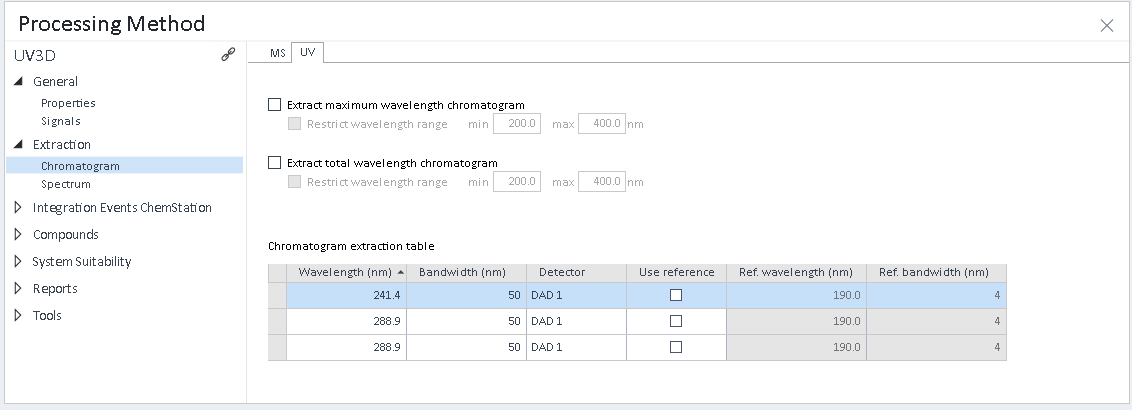
The extraction parameters corresponding to your selection are added to the chromatogram extraction table in the processing method. Chromatograms will automatically be extracted on next reprocessing.
base-id: 11016370827
id: 11016370827