Zoom and scale the isoabsorbance plot
Zooming
By
default, the three graphs are not synchronized on zooming. To synchronize them,
click
![]() in the isoabsorbance plot toolbar. Both Wavelength and Retention time axes, as well as the dashed
lines, are then automatically adjusted on zooming. If required, you can move
all axes by dragging them with the mouse.
in the isoabsorbance plot toolbar. Both Wavelength and Retention time axes, as well as the dashed
lines, are then automatically adjusted on zooming. If required, you can move
all axes by dragging them with the mouse.
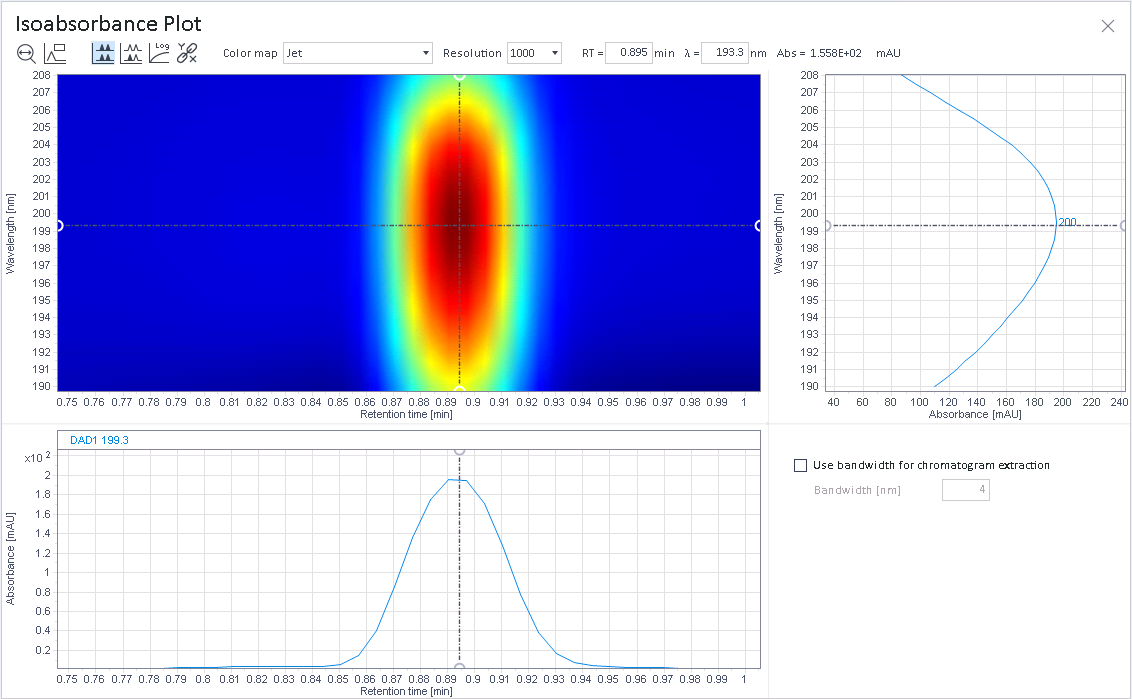
Zoomed isoplot
Scaling
For isoabsorbance plots, the following scaling options are available:
| Absolute Full Scale: The y-axes use absolute response values. |
| Relative Full Scale: The y-axis use relative values with a maximum of 100. |
|
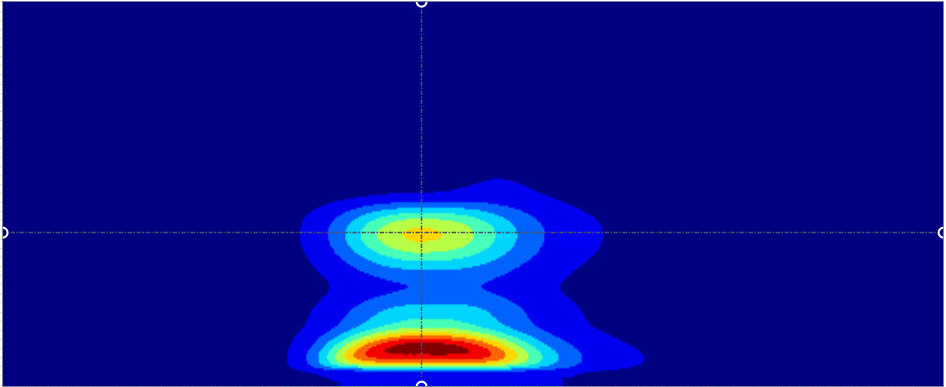
Logarithmic Scale: The response values in the isoabsorbance plot (reflected by colors) use a logarithmic scale. This option can help visualizing small peaks. Isoabsorbance plot example with linear scaling:
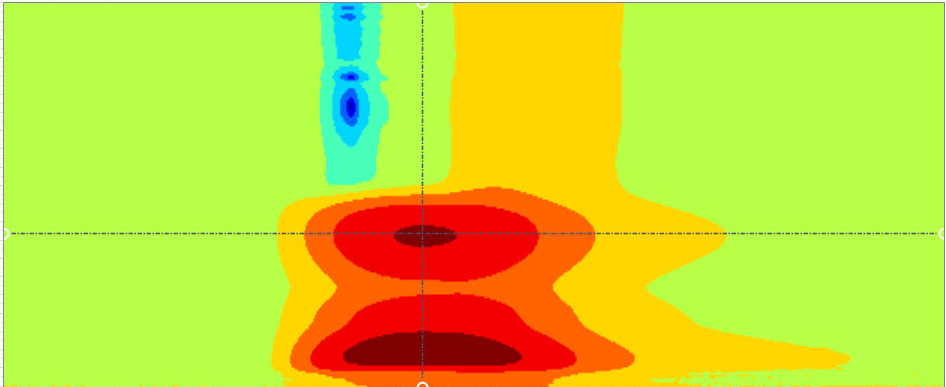
Isoabsorbance plot example with logarithmic scaling:
|