Pin and compare different graphs from the isoabsorbance plot
Move the mouse over the dashed lines. You can use both the lines in the isoabsorbance plot or in the spectrum or chromatogram. A wheel is shown at both ends of the line that offers different functions.
Compare spectra at different retention times
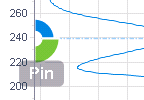
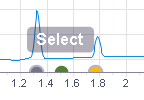
Drag the vertical dashed line to the relevant retention time.
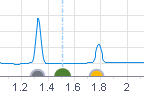
Click the green Pin segment of the wheel.
Pin other retention times the same way.
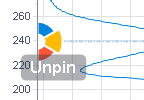
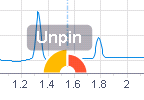
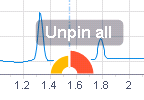
To unpin one specific retention time, select the corresponding pin, then click the yellow Unpin segment of the wheel
To unpin all retention times, click the red Unpin all segment.
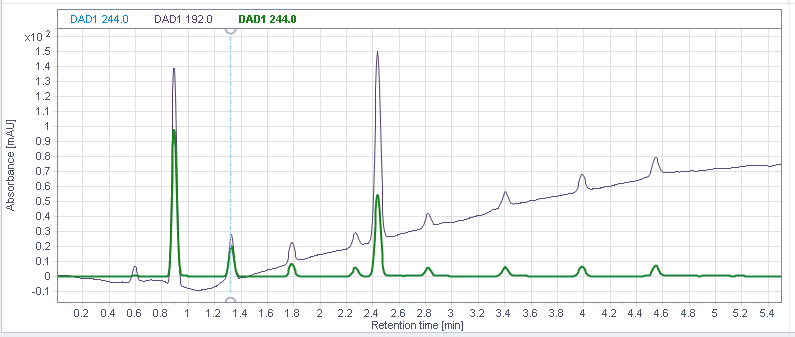
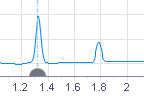
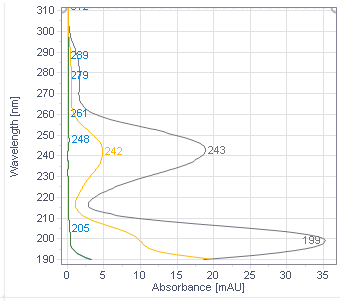
The spectra graph shows spectra in the corresponding colors for all pinned retention times.
The pinned position is marked.
Each pinned position is marked with a different color.
Compare chromatograms at different wavelengths
Move the horizontal dashed line and use the wheel to pin specific wavelengths.
The chromatogram graph shows extracted chromatograms for all pinned wavelengths.
Note that there is an additional blue segment to save extraction parameters to the method (see Save extraction parameters to the processing method).