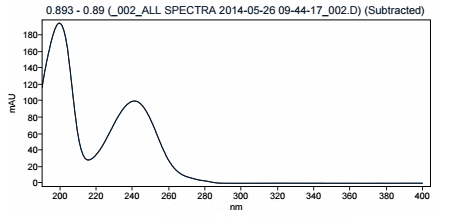
Spectra (UV/Vis)
Peak Spectra Selection
Here, you can specify how to extract the spectra that are shown in the report.
Same as Data Analysis - Peak Apex | Extract spectra the same way as it is done automatically in the Data Processing view (that is, from the peak apex). If background spectra are subtracted, they are marked as Subtracted in the report. Select Report manual spectra if available to additionally display spectra that have been manually extracted (by default, only peak spectra; see Report manually extracted spectra not associated with any peak). Select Do not report apex spectrum to omit the apex spectrum for peaks that have a manually extracted spectrum. For peaks without a manually extracted spectrum, the apex spectrum is still reported. This check box is only active if Report manual spectra if available is selected.
|
Custom (uncorrected) | Select the exact position in a peak from which the spectrum or spectra will be extracted. Background subtraction will not be done. The graph shows the selected positions (Start, Apex, End, Valley, one or more Up Slope or Down Slope positions).
Example: Start, Apex, and End positions |
Display Reference Spectrum
If the processing method of the reported injection contains reference spectra, they are inserted at the top of the listed spectra. The titles of reference spectra always start with the REF prefix.
By comparing a reference spectrum with the current spectrum of an identified compound, you can confirm the identity of the compound.
Spectra Lambda Min and Max
If you select Show Labels, you can choose among several display options for the labels.
|
Annotate Lambda Max. |
A label is shown for each maximum in the spectrum. |
|
Annotate Lambda Min. |
A label is shown for each minimum in the spectrum. |
|
Connection Line |
A line is shown that connects each label with the according point. |
|
Automatic Shift |
If the labels are close together, the system automatically adjusts the location of the labels in order to avoid an overlay. |
|
Show Marker |
A small triangle is shown at the labeled wavelength. The marker symbol and color are fixed. |
|
Bounding Box |
A box is shown around each label. |
|
Detection Sensitivity |
You can choose among three different sensitivity levels for the detection of the maximum and minimum values. |
|
Label Font |
Click the Font... button to configure the font and style of the label texts.
|
|
Default Coloring |
With the Default Coloring option, the system automatically uses different colors in for the labels, corresponding to the colors of the different spectra. |
|
Use Color |
Use the same color for all labels. |
See Also
base-id: 11031166859
id: 11031166859