Matrices
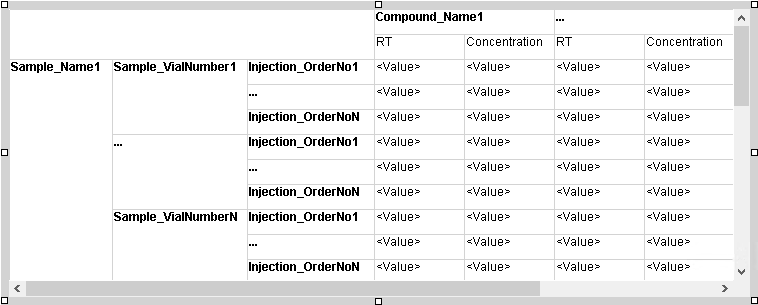
Matrices are like pivot tables or crosstabs in a spreadsheet. As we have seen in the previous chapters, tables contain a variable number of rows, depending on the dataset contents, and a fixed number of columns with detail information. Matrices, however, also contain a variable number of columns. The number of columns depends on the dataset contents. In a table, for example, you can show a list of all compounds found in a specific injection, and the columns show the specific properties (such as amount or retention time) of each compound. In a matrix you can show a list of all injections; the number of columns corresponds to the number of detected compounds in the injected samples.
NOTE
If your data contains multiple signals, the matrix items in the Report Template Editor will only show the main signal.
Subpages
base-id: 11030740619
id: 45036007304445579