Diagnostic Signals
What do you want to do?
The Diagnostic Signals window
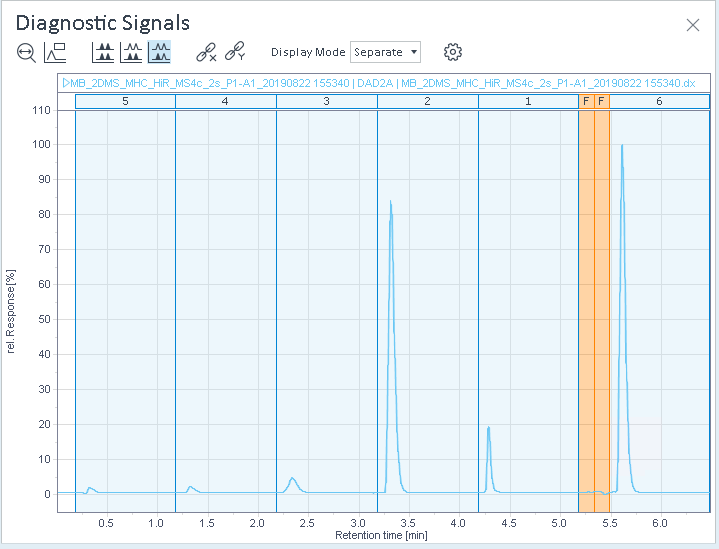
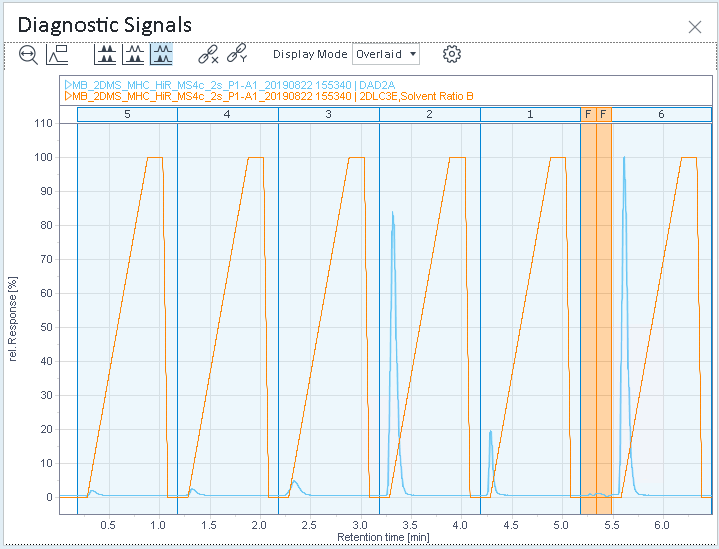
For diagnostic purposes, the full length chromatograms of the ²D detectors are displayed in the Diagnostic Signals window. Instrument Traces of the second dimension that are continuously recorded over the entire runtime are displayed as well (for example, flow, pressure, solvent ratio). Cut ranges are displayed and annotated with their cut number. Each cut section in the diagnostic signal corresponds to a ²D chromatogram. Flush periods are also displayed and marked with an F in the cut annotation header.
View and compare signals
By default, a diagnostic signal is plotted individually in a single graph. Select the signals in the Signal selection tab of the Sampling Table, where you also find the section Instrument Traces.
For a better comparison of the signals, adjust the display mode and scaling of the panels.
Multi-inject
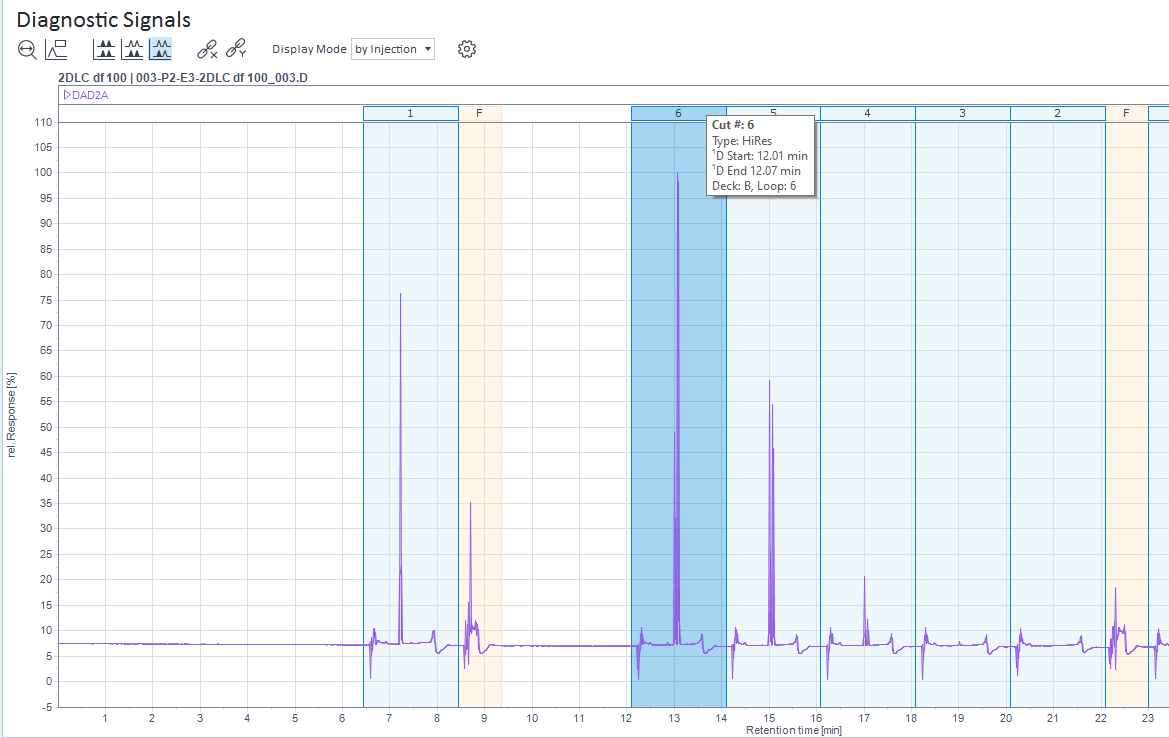
If High-Resolution data is acquired in multi-inject mode, cut annotation headers are shown as follows:
Cut annotation header 0: This section contains the pre-gradients of the multi-inject series where the solvent is injected from the loops.
Cut annotation header with cut number range, for example 1...5: This section contains the analytical gradient of the multi-inject series.
The tool tip shows HiRes (Multi-Inject).
base-id: 10237141387
id: 10237141387