Extract an MS spectrum from a ²D signal
Prerequisites
|
-
To automatically subtract background spectra: In the processing method, select the Extraction > Spectrum ²D node (MS tab), and adjust the Background mode settings.
The background mode under Arbitrary spectra has an effect on spectra that you extract outside of a peak.
The background mode under Peak Spectra has an effect on spectra that you extract between peak start and peak end.
To modify the type of spectrum you want to extract via right-click: Under Spectrum type, choose if you want to extract peak apex spectra or average peak spectra.
-
Select the relevant cut or cuts that contain the peaks for which you want to extract the spectra.
See Select cuts.
-
In the Chromatograms ²D window, navigate to the relevant peak.
-
As with mass spectrometry in the 1st dimension, there are different ways how you can extract an MS spectrum:
In the ²D chromatogram, right-click the peak, then select Extract spectrum.
This extracts either a peak apex spectrum or an average peak spectrum. To define the spectrum type, modify the Spectrum type setting in the processing method under Extraction > Spectrum ²D (MS tab).
In the toolbar of the ²D chromatogram, click
 to activate the spectrum extraction
tool.
to activate the spectrum extraction
tool.Move the mouse over the signal, and click at the required position. Confirm the spectrum extraction.
or
Move the mouse over the baseline, so that the Background hint is shown. Click at the required position. Confirm the background spectrum extraction.
or
Drag the mouse over a range that includes multiple peaks. Confirm to extract spectra for all included peaks.
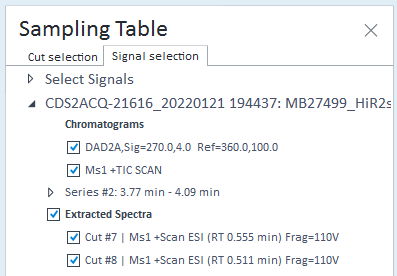
All extracted spectra from the ²D signal are listed in the Signal Selection tab of the Sampling Table window.
See Also
base-id: 10237437579
id: 10237437579