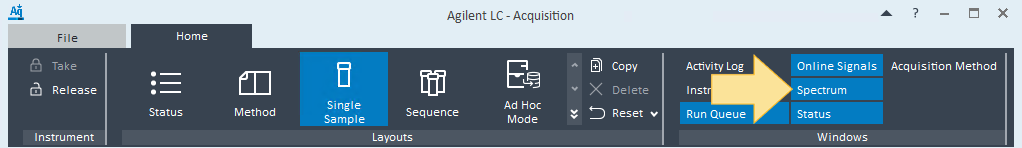
View spectra
Monitor your detector spectrum output, if supported by the associated instrument.
Open the Spectrum window.
Select the spectrum check boxes on the left to display their signal.
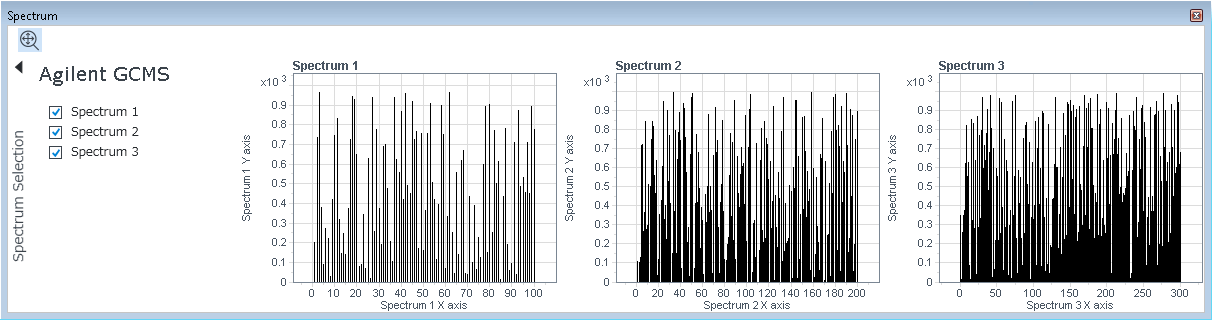
You may zoom or autoscale the Spectrum window in the same way you zoom or autoscale the real-time plot.
Subpages
base-id: 12676075275
id: 9007211930816267