Configure LC/MS sample purity
Privileges
|
Prerequisites
|
NOTE
The Sample Purity Results window is not displayed by default. Open it from the ribbon.
-
Load the relevant data.
If you prepare a method for automated processing after acquisition, you may load an initial data file that has been acquired without a processing method.
-
In the Injection List window, check the targets for the purity calculation. The targets may already be set in Acquisition. If required, adjust the targets in the columns Target 1 - Target 5.
You can enter a molecular mass (for example, 310) or a formula (for example, C12 H14 N4 O4 S).
If the injection has no processing method linked to it, open or create an LC/MS Sample Purity method and link it to the injection.
NOTE
Only methods with the method configuration LC/MS Sample Purity contain the MS Sample Purity section.
To align different signals: Select an integrated peak that occurs in all signals being used; in the General > Signals node of the processing method, select the relevant signals, and enter the retention time for the peak in each signal. Click Calculate delay from RT (see Align chromatograms from multiple detectors).
The delay will be applied the next time you reprocess. The chromatograms (for example, MS and UV) will then be lined up.
-
In the Extraction > Spectrum node of the method, configure the way you want to consider background subtraction.
Select the Extract spectra from integrated peaks on reprocessing check box.
-
In the MS Sample Purity > Properties node of the method, select the Calculate sample purity check box.
-
Provide the Minimum purity limit.
After reprocessing, a color code in the Sample Purity Results window will indicate whether all targets have been found and the overall sample is pure. Purity values lower than the Minimum purity limit are colored red.
Choose a Signal. If you choose an MS signal, select the calculation you want to use.
If you acquire both positive and negative data, choosing a non-MS detector signal may produce better results.
Depending on your choice, the corresponding formula is used to calculate the purity. For details on the calculation, see MS Sample purity calculation.
In the Positive Ions and Negative Ions tabs, select the adducts that may attach to or detach from your target molecule and cause a change in observed m/z .
If required, enter new charge carriers or neutral losses, and click + to add them to the list. Adjust the min and max charge states of your target ion, and select the aggregates your ion may build.
Reprocess the data.
The application extracts EICs based on the targets, adducts, dimers/trimers, neutral losses, and charge states. All EICs are shown in the Chromatograms window and listed in the injection tree.
For example, if 310 is a target and +H and +Na are adducts, EICs will be extracted for 311 [M+H] and 333 [M+Na].
-
In the Chromatograms layout, open the MS Spectrum and Sample Purity Results windows.
In the MS Spectrum window, an MS spectrum is shown for each integrated peak.
In the Sample Purity Results window, a color code indicates whether all targets have been found and the purity of the overall sample is above the specified limit.
To show only pure results or only impure results, click the respective button at the top of the table.
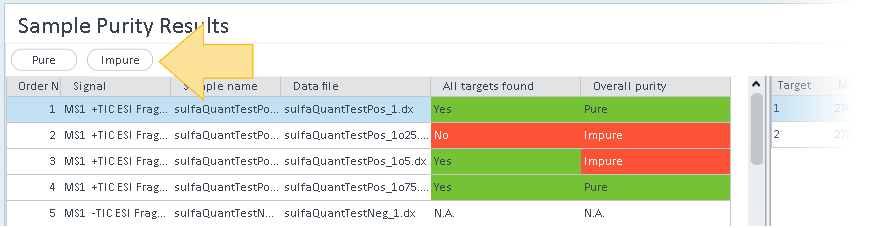
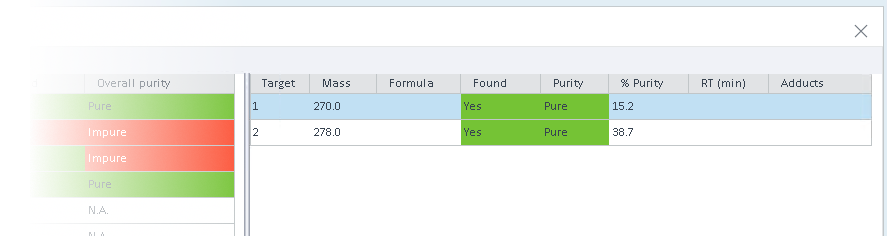
The right part of the window shows the detailed values for all targets in the selected injection. As soon as one target has not been found or has a purity value lower than the specified limit, the Overall targets found and Overall purity columns for an injection are colored red.
See Also
base-id: 11017345675
id: 18014409526827659