UV Spectrum
What do you want to do?
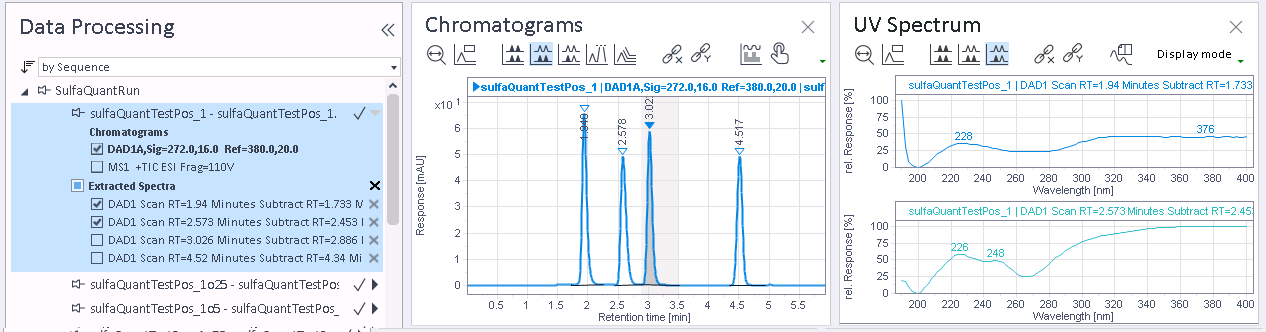
This window shows the extracted UV spectra of the focused injection and of pinned injections (if any). The spectrum associated with the selected peak is highlighted (bold lines and fonts). Show or hide specific spectra by selecting the corresponding check boxes in the details area for the injection. The way multiple spectra are displayed depends on the selected display mode.
Zooming
To zoom into a specific section of the spectrum, drag the mouse over the required section.
To move the x- or y-axis, grab the axis and move the mouse. The mouse arrow turns into a double arrow when it is located over an x- or y-axis.
Scaling
The UV Spectrum toolbar offers different options to scale the spectra.
UV Spectrum Annotations
In the UV spectrum, wavelength maxima are annotated. However, the application annotates a maximum only if the curve in front of it is steep enough. The required slope is defined by a fixed threshold value. You cannot change this threshold.
Subpages
base-id: 11013369099
id: 9007210268110091