Chromatograms ²D
What do you want to do?
Adjust graphs (display modes, scaling options, zooming in and out)
The Chromatograms ²D window shows the signals of cuts that have been analyzed with a detector of the second dimension.
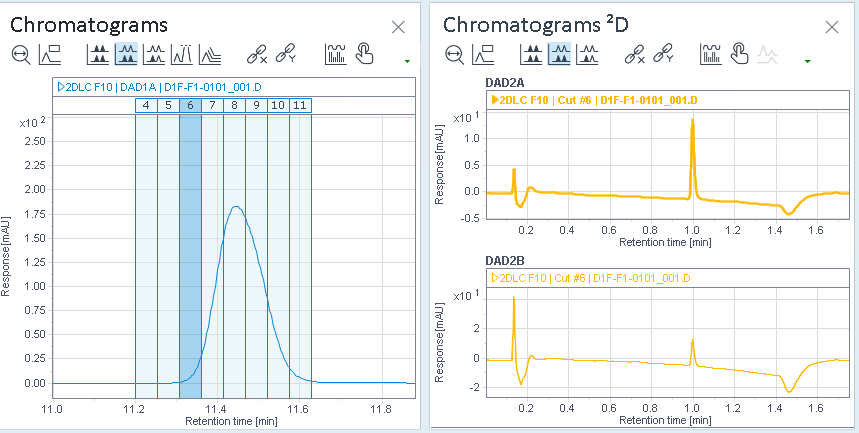
All display modes that you can use in the ¹D chromatogram are also available in the ²D chromatogram (see Display modes). In addition, the ²D chromatogram allows you to display separate panes by Cut Number
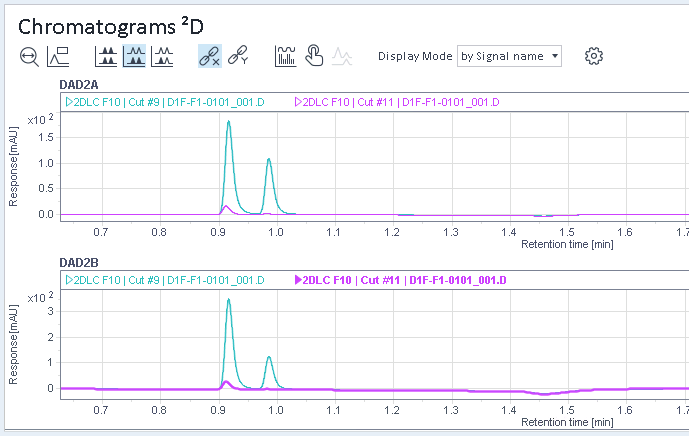
Signal colors
If you view the ²D signals in separate panels by signal name, each cut is shown with its own color. A specific cut has the same color in all signals.
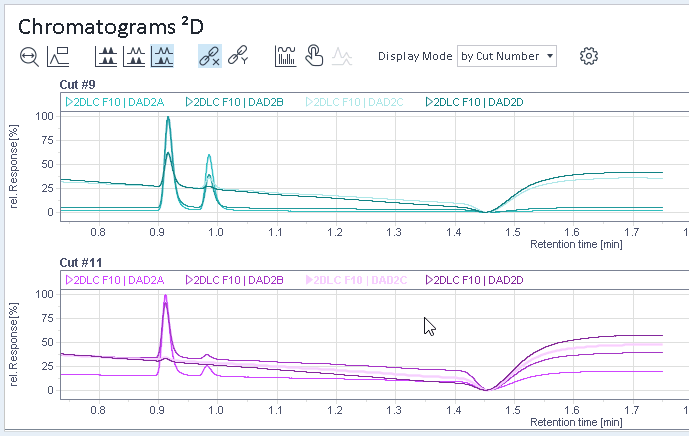
If you view the ²D signals by cut number, the different signals are shown with different shadings of the same (cut-specific) color.
Subpages
base-id: 10237102347
id: 9007209491843339