View a specific workload state of an instrument
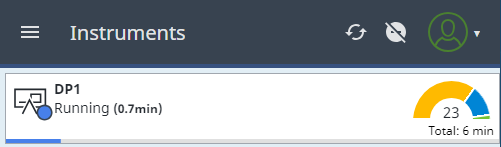
In the main menu, select Instruments.
To view all analyses with a specific workload state of an instrument, click or tap the desired workload state in the half-circle radar of the instrument (for example, workload state
 Queued of
Instrument1).
Queued of
Instrument1).
The Analyses view opens. Only those analyses of Instrument1 that are categorized in the selected workload state are displayed. The filter and instrument name are displayed in brackets.
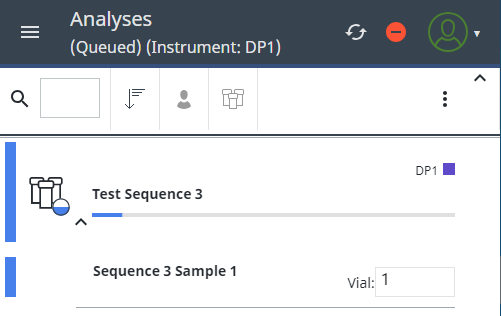
For more information about the individual components displayed in the Analyses view, see Analyses.