Analyses
Analysis Workflow
The analysis state evolves according to a logical workflow that from creation in the Sample Scheduler database to acquisition by the CDS.
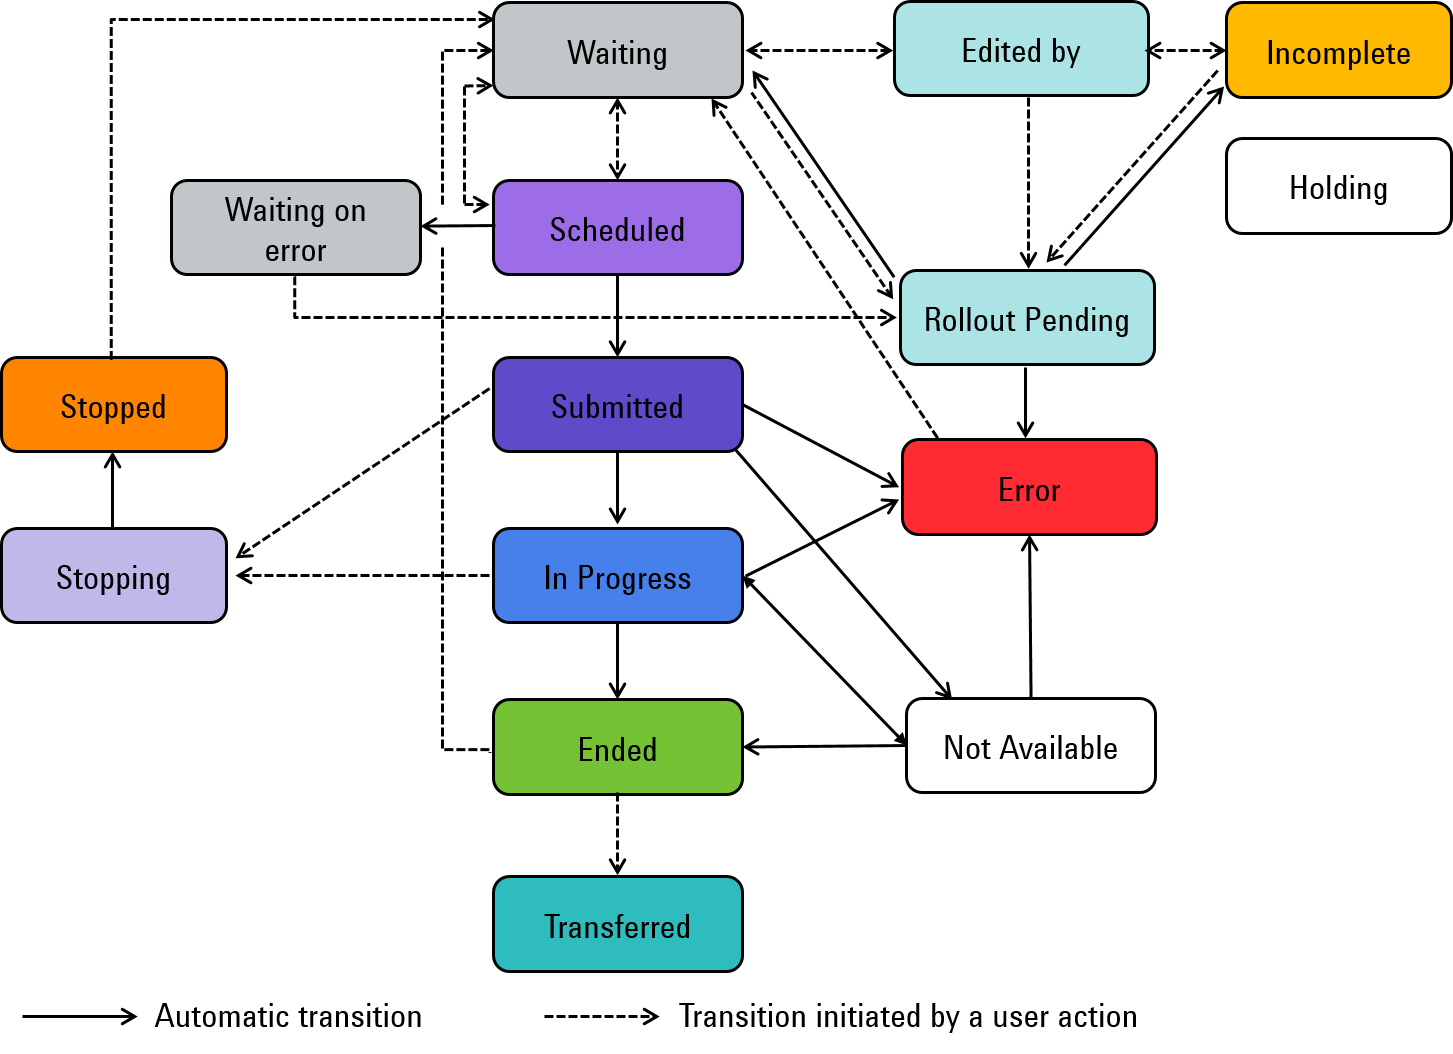
The initial state of an analysis can be:
Waiting: The analysis is associated with an instrument and a method. It is ready to be started; you have the option to edit it to modify some parameters (vial position for example). It’s up to you to queue the analysis by clicking the Schedule button.
Scheduled: The analysis is queued, it will start as soon as the instrument is idle and all the analyses with higher priority (that is, lower number) have been launched.
Holding: The analysis is not associated with an instrument/method. It cannot be edited or started. It is intended to be merged manually with another Holding analysis in the Sample Scheduler client. Once merged, the two analyses are associated with a Dual Injection Sources Instrument. Each of two ‘merged’ analyses will be injected on one or the other Injection source of the instrument. The aim is to optimize the instrument use by injecting two different samples on the same instrument simultaneously (same analytical method used).
Holding state is defined within the XML command. The XML structure is different from a classical one. An XML template is provided UNDER: <Scheduler Install path>/Documentation/ Holding_Command.xml.
When the analysis is launched in the CDS, its state can be:
Submitted: The analysis is currently starting on the instrument. The Sample Scheduler acquisition agent requires an Instrument Control License to submit the analysis to the instrument.
In Progress: The analysis is currently acquiring on the instrument. The acquisition is managed by the CDS.
Not Available: The AIC has lost connection to the instrument. Until the connection can be reestablished, the analysis is put into this state. If the connection cannot be reestablished before the grace period runs out, the analysis is put into the Error state.
Error: The analysis encounters an issue:
the instrument is locked (only the analyses from the LIMS that are submitted in Scheduled state will change to the Error state),
communication with instrument failed,
an error occurred on the instrument,
an error occurred in the CDS.
Waiting on error: When several analyses are launched on the same instrument, one analysis is in acquisition (Submitted or In progress) while the others are Scheduled. When an error occurs, the current acquiring analysis turns into Error state, and the Scheduled ones into Waiting on error state. It is the user's responsibility to restart them when the issue is solved.
Stopping: The analysis has been stopped by a user via the Sample Scheduler, and is currently stopping in the CDS. This state is transient.
Stopped: The analysis has been stopped by the user via the Sample Scheduler.
Ended: The analysis has been acquired. The results are available in the CDS.
Incomplete: The analysis does not contain a value for all parameters that are required by the CDS to perform the acquisition (for example, project, instrument, acquisition method, injection source).
When the analysis has been reviewed in Sample Scheduler client and the result reports have been submitted to LIMS, its state can be:
Transferred: The result reports have been transferred to LIMS.
For more information, see Review results for LIMS.
When a sequence template is applied to analyses in the Sample Scheduler web interface, the state of the sequence can be:
Rollout Pending: Sequence templates are created in OpenLab CDS Acquisition. When the sequence template is applied to the analyses, the resulting sequence is transferred into the state Rollout Pending. The status is intended to inform you, that the sequence is about to be rolled out. In this state, you cannot edit the parameters or perform any action on the sequence, except using a reset. In case you reset the sequence, the state is transferred to Error. The Rollout Pending state persists until the complete sequence has been created in the database. If the rollout has been successfully completed, the sequence state turns into Waiting, or Incomplete (in case mandatory parameters are missing). The sequence now contains the run-by-run list, exactly as it will be executed, with all repeat calibrations, QC samples, and blanks included in the correct order.
Subpages
base-id: 11194608139
id: 54043206723054091