Calibration curves
What do you want to do?
Learn about the data of the displayed curve
If a calibration curve is available, this window shows the calibration curve for the selected compound.
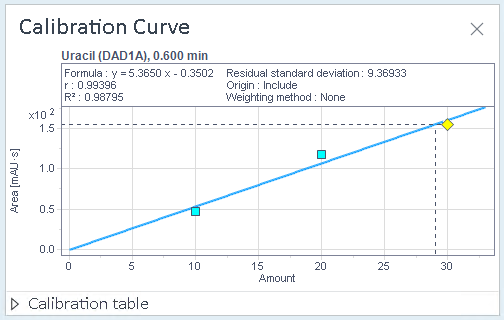
The title of the graph contains the compound name, its signal, and the expected RT. The legend shows details on the curve. The values depend on the selected curve model. Included are, for example, the model equation, the residual standard deviation, the correlation coefficient r, or the determination coefficient R².
A calibration curve can contain the following elements:
| Blue squares: average calibration points (not shown if you use individual points for curve calculation) |
| Yellow diamond: point corresponding to the selected injection. The compound area and the calculated amount for the selected injection are drawn with a dashed line. |
| Blue circles: points corresponding to other calibration samples in the same sequence. |
| Red cross: point has been disabled and is ignored for calculations. |


The appearance of the curve depends on the parameters set on the General tab of the Calibration section in the processing method:
If you calculate the curve from individual calibration points, the average calibration points are not shown in the calibration curve.
Depending on the selected RF definition, the curve shows either the amount on the x-axis and the response on the y-axis, or vice versa.
If you use internal standards, the relative response and relative amount are shown in the calibration curve.
In addition, the compound specific parameters in the Compound Table tab influence the appearance of the calibration curve:
The response type can be Area, Area%, Height, or Height%.
If you select the Log/log curve model for a compound, the calibration curve shows the logarithmic values of both response and amount.
For details on the calibration parameters in the processing method, see Processing method: Compounds: Calibration.
For details on the calculation, see Calibration curve calculation.
Scope of calibration curves
The method calibration curve is stored in the processing method. It is built up and used at the end of acquisition. Also during reprocessing, it is either rebuilt or updated (depending on the Run type values). It contains the complete calibration curve, including all calibration standards and calibration points of the entire sequence.
The individual calibration curves resulting from each set of calibration standards are part of the ACAML file (see Agilent Common Analytical Markup Language (ACAML)), which is physically stored in the result set folder. These individual calibration curves represent the status of the calibration curve at the time of processing, and they are synchronized with the method calibration curve after each set of calibration standards. If further sets of calibration standards will be processed later in the sequence, those calibration points are not yet included. The Calibration Curve window always shows the individual calibration curve that applies to the currently selected sample.
Calibration table
You can expand or collapse the calibration table. It shows the actual values that are graphically shown in the calibration curve, and in addition it contains information on each of the calibration points. The following columns are available:
Use: Check box to enable or disable a calibration point.
Level: Level of the calibration standard.
Average response: Average response of all individual calibration points in this level.
Average amount: Average compound amount in the calibration standard for this level.
Residual per level: Distance between the measured response of a calibration standard and the predicted response that is calculated using the calibration curve.
Rel. residual: The Residual divided by the predicted response.
Rel. residual %: The Residual divided by the predicted response, in percent.
Response: Magnitude of the signal (height or area). If multiple calibration points exist for a level, the single values are shown in separate rows.
Amount: Corrected amount, calculated from compound multipliers, compound dilution factors, and compound amount in the calibration standard for this level. If multiple calibration points exist for a level, the single values are shown in separate rows.
Injection: Path to the data file for each calibration sample. If multiple calibration points exist for a level, the single paths are shown in separate rows.
Modification date: Date when the last calibration curve for the compound has been created. This column is only visible if the Show modification date in the Calibration Curve ribbon tab is selected.
Subpages
base-id: 11013170059
id: 11013170059