Evaluate MS qualifier results
In the Injection Results window, the value Qualifier Passed shows if the requirements have been met.
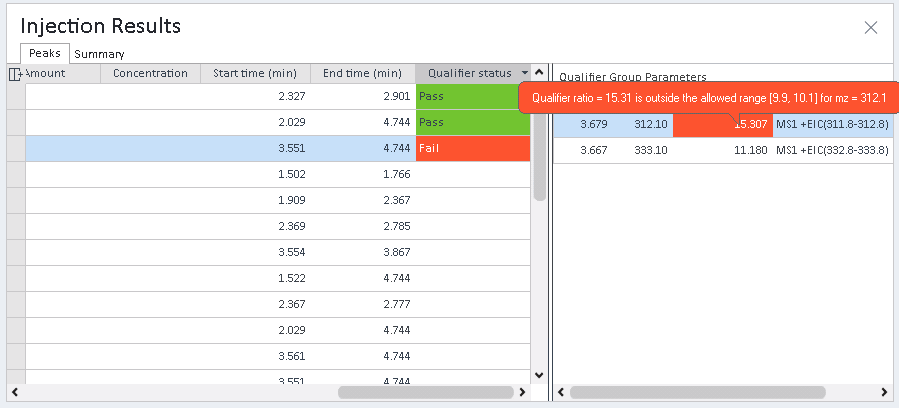
Click the row in the injection results table to show the qualifier group parameters to the right of the table. If a qualifier failed, hover the mouse over the red cell to see a tooltip with details.
Qualifiers may fail due to the following:
Qualifier ratio is outside the allowed range
The allowed range for the qualifier response ratio (Rsp (%)) is defined by:
The target response
The response window for the specific qualifier (Rsp window (%), see Processing method: Compounds: Identification, Qualifier group details)
The response window type (Qualifier response window type, see Processing method: Compounds: Identification, Qualifier Setup tab)
The qualifier response ratio (Rsp (%)) is calculated using either base peak SIM/EIC or TIC as a reference. See MS qualifier calculations.
If the allowed range is 0.0-0.0, check the qualifier response ratio (Rsp (%)) in the processing method. It may have been set to 0.00, for example, on changing the response definition of a calibrant. To update the expected ratio see Update qualifier responses.
Qualifier peak not found
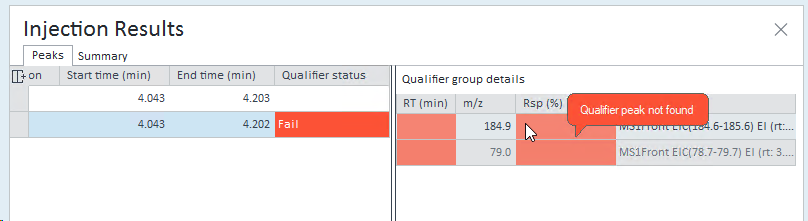
Check the SIM/EIC for the qualifier. Does it have an integrated peak?
If there is no integrated peak in the SIM/EIC: Optimize integration of EIC or SIM peaks
If there seems to be only a baseline in the SIM/EIC: Check the extraction window Exp. RT (min) ± SIM/EIC extraction retention time window for target compounds
SIM/EIC extraction retention time window for target compounds: see Processing method: Extraction: Chromatogram (MS tab)
If the qualifier peak is integrated in the SIM or EIC, check if the qualifier retention time matches the compound retention time. The expected qualifier retention time is defined and can be edited in the method (RT (min) column, see Processing method: Compounds: Identification, Qualifier group details). The qualifier retention time window is defined by Qualifier RT window ( ± min ) in the method, see Processing method: Compounds: Identification, Qualifier Setup tab.
Reference peak not found
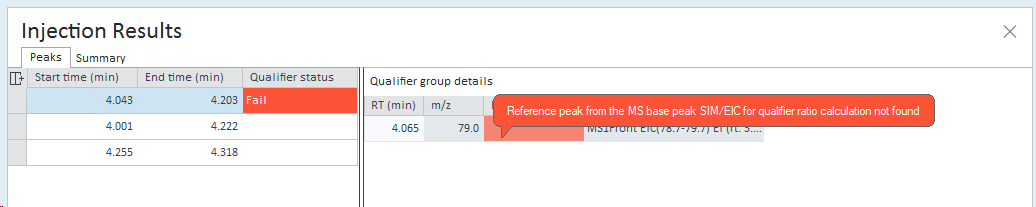
If your compound is defined on a TIC signal, check the SIM/EIC for the base peak. If there is no peak: Optimize integration of EIC or SIM peaks
The base peak m/z is the most abundant ion in the compound's MS spectrum; it was automatically determined by the application at the time the compound was added to the method.
In the injection tree, TIC and base peak EIC or SIM are always listed next to each under the relevant component name.
| TIC signal and corresponding base peak signal. Base peak m/z value is the most abundant ion in the compound's MS spectrum. |
| Qualifier signals |


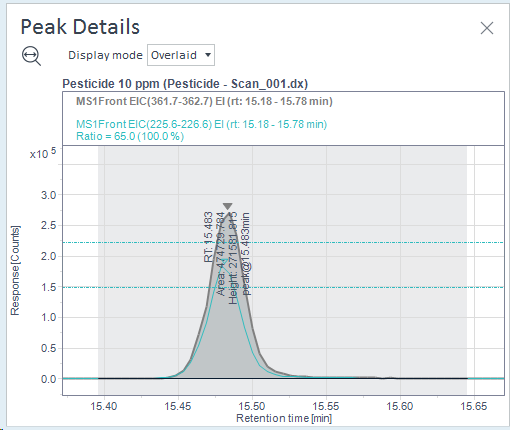
Peak Details
In the Peak Details details, the qualifier peaks are shown as an additional signal, including limit lines for the allowed response window. The following example shows the peak details for a compound with one qualifier in the Overlaid display mode.
See Also
base-id: 14063270539
id: 14063270539